Your reports, your way, with Bulbshare’s Cross Tabs. Cross Tabs allow you to compare results across one or more fixed variables against other subgroups of data, to examine the relationship between them. These are some benefits of this functionality:
- Question-based report configuration.
- Report configuration based on participants’ demographics, tags, and segments.
- Count value calculation as absolute or percentage.
- Multiple table and graph visualisation.
How to access Cross Tabs:
- Access the advance report of the brief that you want to analyse.
- Once you are in the report click on the ‘Cross Tabs’ button to access.

How do they work:
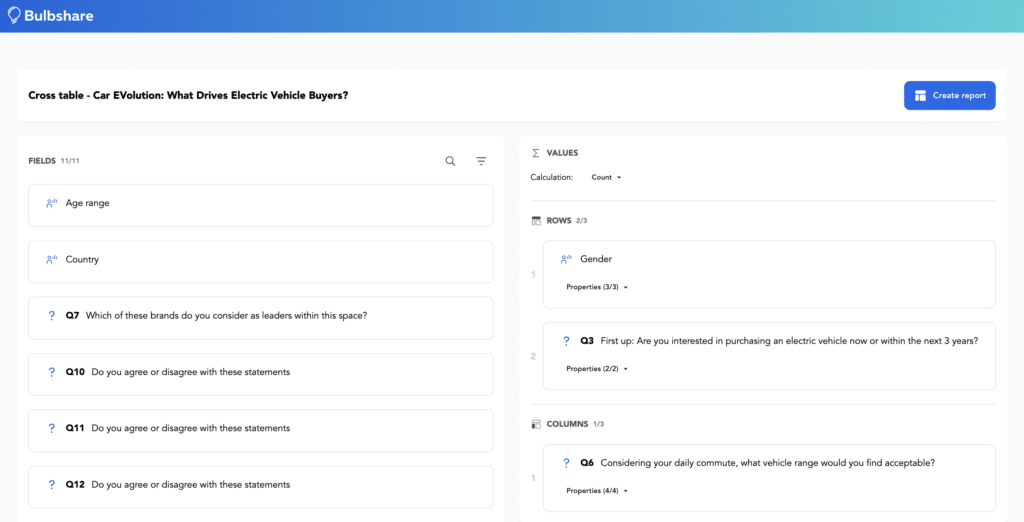
Cross Tabs allow you to compare categorical data across different questions. The questions supported in this functionality are the close-ended questions, where respondents need to select between different options: Multiple-choice, Swipe, AB or Image Grid, and demographic or tagged data. Create your report in 3 steps:
- Select the field variables you want to compare and put them in the rows or columns, depending on how you want to display the data.
- Select how you want to represent the data, total values, percentages…
- Once you are ready, click on ‘Create Report’ to generate a table. You will only be able to create one table at a time but can open the same window as many times as you want.
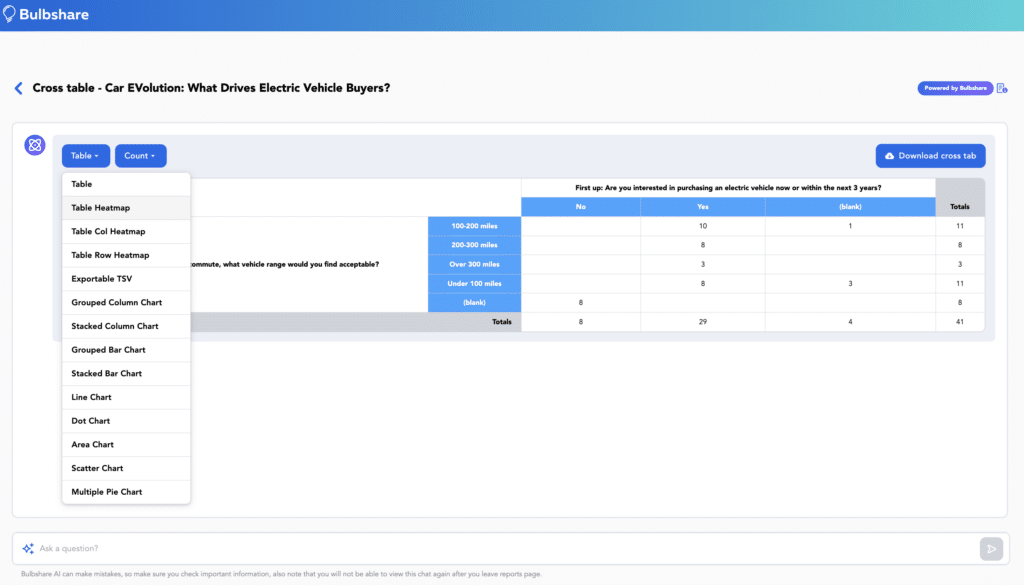
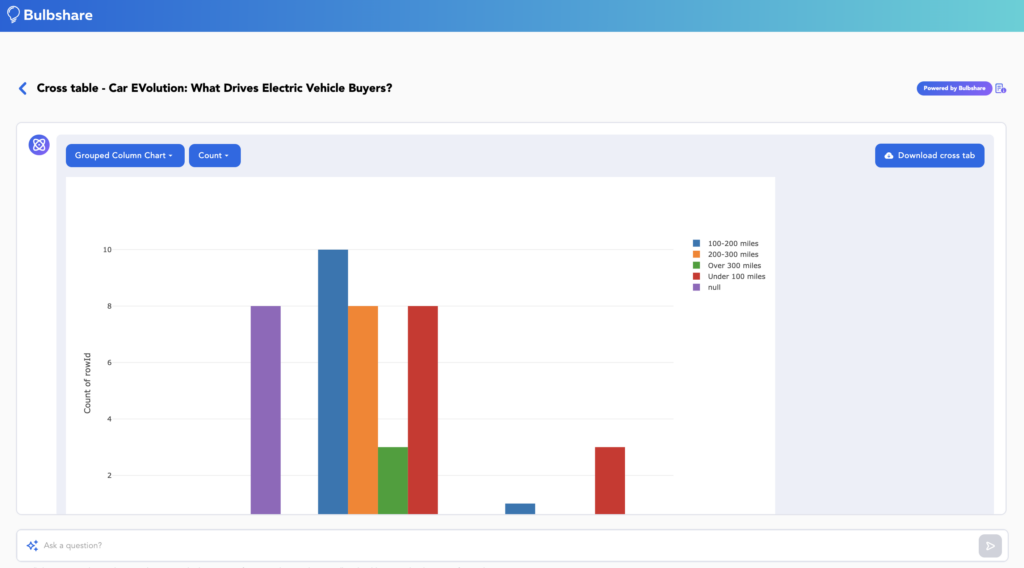
Data can be displayed in different types of tables, graphs or TSVs.


Interrogate data
Cross tabs include an AI that will respond to any questions you might have about the table or chart you’ve created.
Export Results
The results can be exported in Excel format for tables and PNG for graphs.

